My Virus Infected Life (Part 2) – Vaccines and Immunity

In the first installment of this blog series I shared a virus-centered autobiography. Some of the inspiration for telling this story was the realization that in addition to the normal experience of viruses with immunizations, childhood diseases, and adult viral infections that my experience as a researcher at Purdue University and at the University of Oregon was filled with virus encounters. Since we are all inundated with news about the current CoViD-19 pandemic, this may be a timely reflection.

I was born in 1958. My very first encounter with the virus world is via the recommended vaccine schedule at the time. This included vaccinations against diphtheria, tetanus, pertussis (DTP), smallpox, and polio. Since diphtheria, tetanus, pertussis are bacterial infections and our focus is on viruses, I will not discuss these diseases. Nonetheless, how our immune system works, the main topic of this post, is more or less the same for bacterial and viral infections.

Smallpox had a 30% mortality rate and even higher among infants. Fever, vomiting, followed by mouth and skin sores that led to significant scarring and sometimes blindness were the symptoms and effects. Smallpox was spread by person to person contact and via contaminated objects. Polio has a 2-5% mortality rate among infected children and a 15-30% mortality rate among infected adults. Although many infected people experience no symptoms, weakness and paralysis of the legs is common. Recurrence of muscle weakness and paralysis can occur years later in post-polio syndrome. My father-in-law experienced polio as a toddler; he experienced the effects of polio the rest of his life. Globally, the number of cases of polio today are in the few hundred compared to millions before the vaccine was developed. Preventing and nearly eliminating such deadly and contagious diseases has been invaluable to public health.

Most of us have a sense of how immunity to infectious diseases works. We get exposed to the virus and our body’s immune system creates a resistance to future exposure to the virus. After being exposed once, we are immune in the future. Exposure comes by experiencing the disease and recovering from it—this is how I developed my current immunity to measles, mumps, rubella, and chicken pox. Alternatively, you can be exposed to the virus with a vaccine, an injection or an oral dose that contains a fragment of the virus or an inactivated or less virulent form of the virus. Your immune system responds as if it had experienced the disease and develops immunity so that you are resistant to future exposure to the real thing.

The modern era of vaccinations began in the 1700s when doctors and scientists noticed that dairy farmers who were exposed to cowpox, a milder disease that is similar to smallpox, did not develop smallpox. Edward Jenner is often named as the person behind these early efforts although there is some debate as to whether he was actually the first. These doctors deliberately began to expose people to the pus from cowpox blisters. They would contract cowpox, but would also gain an immunity to the deadlier smallpox. Modern versions of the smallpox vaccine continued this basic idea. Live cowpox virus (not smallpox itself) was used to elicit the immunity to the smallpox virus. Because smallpox has been eradicated among humans, this vaccine is no longer administered.

There are two forms polio vaccine used. For people my age the most common form was the oral polio vaccine (OPV) which is a weakened version of the virus where many mutations were introduced in the course of growing the virus. These mutations led to an attenuated form of the virus which conveyed immunity but which did not cause the disease (although three in a million OPV doses result in an active polio infection). The vaccine commonly used today is the inactivated polio virus (IPV) which is given by injection. Live virus is inactivated with formaldehyde/formalin.

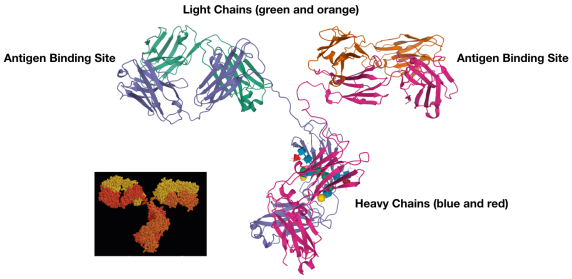
Figure 1. The three-dimensional structure of a mouse antibody (1IGT) from the Research Collaboratory for Structural Bioinformatics (RCSB) Protein Database (PDB). The protein consists of four chains, two heavy chains (each with about 400 amino acids) and two light chains (each with about 200 amino acids). The representation shown here is known as a ribbon diagram where the polypeptide chain is traced and elements of structure highlighted (for example, beta strands shown by the flat arrows). The antigen binding site is made from the variable regions of a heavy and a light chain to give a unique binding site that recognizes a specific antigen. The inset shows the space-filling representation of the same molecule shown in a similar orientation. Many people are familiar with the V-shaped H2O molecule that has 3 atoms. The antibody has about 20,000 atoms.

The immune response in humans comes from two cell types: B cells and T cells. B cells are named after the bursa organ in birds where they were first discovered. Humans don’t have bursa—in humans B cells are made in the bone marrow (which conveniently also starts with the letter B). T cells come from the thymus, an immune and endocrine system organ located between the heart and the sternum. B cells make antibodies. Antibodies are protein molecules that recognize and bind to foreign substances (known as antigens) that are parts of viruses or other pathogens. See Figure 1. This recognition is very specific and is based on the three dimensional structure of the antigen and the antibody. The way a key fits into a lock or a hand in a glove is a good image. Molecules are more flexible and dynamic than a mechanical lock and key which results in a very specific and tight interaction between the antigen and the antibody. This is sometimes referred to as an induced fit. The binding of the antibody prevents some aspect of the virus’s normal action. Antibodies can bind to a viral protein responsible for attaching to the host cell. A virus with an antibody bound would not be able to infect a cell. Alternatively, antibody binding to a virus tags the foreign pathogen or substance to be destroyed by other immune system cells that engulf and digest foreign substances.

The way our body creates these antibodies to the foreign molecules is remarkable. We do not have enough genes to make antibodies against every possible foreign molecule found on the surface of a pathogen (parasite, bacteria, virus, or toxins produced by a pathogen). But in our genome there are sections of DNA that combine in different ways to make the gene in a given mature B cell that codes for the antibody. Slight errors in the recombination process introduces additional mutations that result in even more permutations. Once matured each B cell produces only one antibody that recognizes a section of a foreign protein or carbohydrate. This way we make millions of different B cells each producing a unique antibody which can target millions of different foreign substances. The initial production of B cell is totally random, but chances that one or several of these would recognize the foreign substance is high. Initially, the antibodies are embedded in the B cell membrane with the antibody binding region sticking out from the surface of the B cell. A B cell with a successfully binding antibody is signaled to proliferate in a process known as clonal selection. These B cells start producing antibodies missing the membrane binding region like the structure shown in Figure 1 that will be secreted and can bind to the foreign substance. This response that is specific to the infectious pathogen takes several days to kick in. Before then, if we have never been exposed to that particular pathogen, we are at the mercy of its effects and our body’s more general response to pathogens. Some of the symptoms that we associate with sickness—inflammation, fever, swelling, increased blood flow, pain—are actually the workings of the innate immune system, the part of the immune system that does not rely on antibody recognition.

In addition to these antibody producing cells (known as the humoral response), some B cells become memory cells. These cells produce antibodies very quickly if exposure to the pathogen occurs a second time. This is the main cellular basis for immunity, this memory and rapid response to a previously seen antigen.

T cells recognize presented antigens and signal the cell-mediated immune response. The cell-mediated immune response produces cytotoxic T cells which recognize and kill infected cells. T cells also stimulate the B cell response. Some cells of the immune system or even infected cells absorb pathogens and digest them into small fragments, e.g. peptides 10-15 amino acids long or fragments of surface carbohydrates. These small fragments bind to a membrane embedded protein called the major histocompatibility complex (MHC) protein. The MHC presents the antigen at the outer surface of the cell. MHC plus the presented antigen is what is recognized by T cell antigen recognition molecules that are similar to antibodies. T cell specificity and variability is generated similarly to how it is generated in B cells. Some T cells remain as memory T cells that result in a more rapid immune response in case the antigen is encountered again.

Since the production of antibodies and other antigen recognizing proteins involves the random combination of pieces of the antibody genes, it is possible that there will be B cells and T cells generated that recognize molecules that are not foreign antigens but are self. Remarkably, the immune system has mechanisms by which these cells self-destruct or are inactivated.

The B cell and T cell response is called the adaptive immune response (in contrast to the innate immune response) because the response is specific to a given antigen and happens only when the given antigen is encountered. Our immune system adapts to the pathogen filled environment that we experience, that is, it changes in response the the environment. Specific B cell and T cell responses to a given antigen occur when exposure to a live or an active pathogen occurs, i.e. when the patient actually catches the disease, Alternatively, the specific B cell and T cell responses also occur when the patient is vaccinated—a deliberate exposure to an inactive form of the pathogen or to a non-infectious fragment of the pathogen. In the first case the person experiences the disease and its consequences but then is immune to further infections. In the second case the person gains immunity without ever having experienced the disease. The second case is surely better, especially when there are significant risks associated with experiencing the disease itself. A significant part of vaccine testing is making sure that the risk associated with the vaccine (side effects, the effect of manufacturing and formulation components, a mild infection from an attenuated form of the pathogen, etc.) is significantly less than the disease. The cure can’t be worse than the disease.

Some of the memory cells last for the entire lifespan of the vaccinated individual. Others do not and a booster shot is necessary to keep the immune system active against the previously exposed antigen. In other cases the virus evolves in such a way that the original antibodies no longer recognize it. Really sneaky pathogens have mechanisms that vary their coat proteins systematically to evade the immune system. The early stages of vaccine development in the case of CoViD-19 have been straightforward, but on an amazingly fast track. Scientists isolated fragments of the coat protein of the virus particle and injected people with it in hopes of producing the immune response described above. Part of the early phase testing is to see if there are any side effects, but part of the testing is to see if the antibodies produced by the initial antigen exposure are actually effective in stopping the disease.

The serum antibody testing that has now been developed to see who already has had the disease detects antibodies in our blood that are specific to the CoViD-19 virus particle. Since there is no vaccine, the only way to have those antibodies is to have had the disease. In principle, testing for the anti-CoViD-19 antibody gives a clear result. People with the antibody have had the disease. In practice it’s not so clear. A small percentage (~5%) of false positives, antibodies to CoViD-19 being present without having had the disease, obscures these results. We also hear about treating a CoViD-19 infected patient with plasma (blood where the red blood cells and other cells have been removed) from a previously infected person. If these antibodies are injected into an infected patient, they could inactivate the virus in the same way that they would if the patient were making their own (which they eventually will). This is known as passive immunity.
My Life with Viruses

640px-T4_infection_wiki
Image from Victor Padilla-Sanchez, PhD/Creative Commons Attribution 4.0 International

With SARS-CoV-2 (Severe Acute Respiratory Syndrome Coronavirus), the cause of the current pandemic named Covid-19 (for Corona Virus Disease 2019), I have realized that my life story could be told around viruses. Viruses have played a role in my life at every stage of my life and not just in getting sick from them. Here is the beginning of what I hope to be a series of blog posts that chronicle this virus infected life now in its sixth decade.

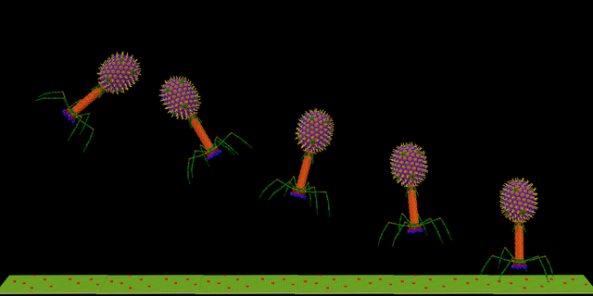
But first of all, what is a virus? Essentially a virus is small particle that contains a segment of genetic material, either DNA or RNA, surrounded by a protein coat, sometimes with lipid components like in cell membranes. Viruses are tenths or hundredths of a micron (1/1000 of a millimeter) in size, smaller than typical bacteria cells but larger than large biological macromolecules like proteins. It is not a cell and it does not carry out metabolism, thus it is not consider to be a living thing. However, it reproduces, evolves, and is composed of biological molecules. Its genetic material has genes that code for the coat proteins and proteins (mostly enzymes) that enable the virus to use host cell functions (DNA replication, RNA transcription, protein synthesis, etc.) to make and release new virus particles. The virus binds to the host cell and injects its genetic material or gets absorbed into the cell by endocytosis. Once progeny virus particles are produced, the cell breaks open and releases many newly synthesized virus particles. Alternatively, mature virus particles are released by normal bulk transport methods such as exocytosis. The figure above show a schematic of one of my favorite viruses (because of its spaceship appearance) bacteriophage T4. Literally, bacteriophage means bacteria eater–it is a virus that infects bacteria. Here you see the virus particle landing on a bacterial surface at a particular protein binding site. It then injects its DNA into the cell. The virus has a capsid, the protein coated head, which contains the DNA, and a tail with a sheath, tail fibers, and a baseplate that docks to the cell surface.

Like most Americans I was vaccinated as an infant against diphtheria, tetanus, and pertussis, the DPT shot, smallpox, and polio. Diphtheria, tetanus, and pertussis are caused by bacteria, but smallpox and polio are viral infections. Because of vaccinations these diseases are no longer the problem they once were. Smallpox has been eradicated from the world, the last case having occurred in the 1970s. Smallpox vaccines have been discontinued. There are two stocks of the virus in the world, one in the US and one in Russia.

Having been born into the world too early to get the vaccines available today, I gained immunity to mumps, measles, rubella, and chicken pox the painful way, by experiencing these childhood diseases. Now vaccines are available for these formerly common childhood diseases. So far my  experience with viruses is fairly typical of an American my age.

The twist that got me thinking about this story is my experiences as a molecular biology undergraduate at Purdue University and as a graduate student in molecular biology at the University of Oregon. At Purdue I landed an undergraduate research position in the protein crystallography lab of Professor Patrick Argos. In the late 1970s Pat was part of a group of structural biologists that also included Michael Rossmann and Jack Johnson. The mainstay of this group was Michael Rossmann–Pat ended up at the European Molecular Biology Laboratory (EMBL) and Jack at Scripps Institute. Protein crystallography and structural biology is the science of determining the three-dimensional molecular structure of large molecules like proteins made of tens of thousands of atoms. The technique is to grow crystals of these molecules, to expose these crystals to a beam of x-rays, to collect the scattered x-rays, then to reassemble the scattered light using computers to get the molecular structure. The Rossmann, Johnson, Argos lab were in a race with Steve Harrison at Harvard to get the first 3D structure of a spherical plant virus. The Purdue group worked on southern bean mosaic virus (SBMV) and the Harvard group worked on tomato bushy stunt virus (TBSV). Sadly for us, the Purdue group came in second place in that race, but there are some interesting stories to tell about that time.

My role as an undergraduate was rather minor. We had to grow these virus in one of the university greenhouses. One of my jobs was to smash up infected plant leaves mixed with some abrasive material and to rub them on the leaves of young plants. These plants would become infected with the virus and later harvested. From there our biochemistry lab technician would purify the virus from the plant material and grow crystals. Another task I had during those years was to use a newfangled computer graphics system called Molecular Modeling System-X (MMS-X) to build the molecular structure of one of the subunits of the virus coat protein into the electron density map (the result of final calculations in the protein crystallography experiment). The basic structure had already been determined and published, this was sort of mop up work, but an amazing privilege for an undergraduate. I was a newbie and it showed. I built a very bad structure–so bad that Dr. Rossmann gave me a B instead the normal A for such research courses. I’ll detail that story later. Michael Rossmann remained active as a structural biologist until his death in 2019. His group had determined the structure of the virus that causes the common cold and most recently the structure of the zika virus.

As I result of that experience at Purdue, I became a protein crystallographer and went to the University of Oregon to work in the lab of Brian Matthews and get my Ph.D.  There I became involved in the T4 lysozyme project. T4 is a bacteriophage, a virus that infects E. coli bacteria. T4 lysozyme is a protein (an enzyme) that breaks down the bacterial cell wall so that newly made virus particles are released from the infected cell to go find other cells to infect. T4 lysozyme had been used in the research of molecular geneticist George Streisinger to confirm in vivo the genetic code, that relationship between a protein sequence and the coding DNA sequence. In the course of the Streisinger research hundreds of mutants (proteins with alternate sequences) had been generated. Brian Matthews chose to work on a career spanning research program of relating the amino acid sequence of a protein to its structure, stability, and folding. By the end of my graduate career we were using newly developed recombinant DNA techniques to grow mutant proteins, but at the beginning I was using the techniques of bacterial virus genetics to make new mutants. To obtain enough T4 lysozyme to make crystals, we would make about 10 gallons of bacterial culture and then infect it with the virus. In the end all the bacteria would be dead and we would have a solution of viruses and the protein, T4 lysozyme, which could be purified, concentrated, and crystallized.

The bacteriophage lambda was also a subject of research at U of O. Whereas bacteriophage T4 is a lytic virus, lambda is a temperate or lysogenic virus. A lytic virus infects cells, makes new virus parts and DNA, and then breaks open the cell releasing 100-150 new virus particles. Phage lambda can do the same, but it also has a mode where it incorporates into the bacterial DNA, and its DNA replicates along with the bacterial DNA. Only under certain stressful conditions does it go back to a lytic phase. Phage lambda was used in research to study aspects of molecular genetics, and it was used in teaching labs for biology and genetics courses. I took some of those courses and was teaching assistant in others.

I also encountered the E. coli virus M13. This virus was used in DNA sequencing experiments which I used in my research to study T4 lysozyme mutants. You can readily isolate M13 double stranded DNA into which you could insert a piece of foreign DNA using recombinant DNA techniques. But you could also isolate M13 single stranded DNA from which you could do DNA sequencing experiments. Because of the tubular structure of this virus you could insert segments of DNA and the virus would just get longer. With a minor extension of DNA sequencing techniques you could introduce specific mutations into the gene via a technique called site-directed mutagenesis.

The Matthews lab had just begun using the these molecular biology techniques when I first arrived there in 1980. I spent many hours learning these methods and then using them in my research.

My experience with viruses beyond these early academic experiences are like most other people. I have personally experienced common cold, influenza, noravirus infections. One of our daughters had to be hospitalized with a rotavirus infection. We  hear of adenoviruses as ways of doing gene therapy.  Society over the past few decades has gone through AIDS-HIV, hepatitis, Ebola, SARS, MERS, swine flu (H1N1), Now we are experiencing the Corona virus that causes CoViD-19 which is affecting our lives today in dramatic ways.

Terry M. Gray
April 6, 2020

Let It Die––A Response to the Proposed Repeal of the Clean Power Plan

About a year ago I wrote the following essay but it was never published anywhere. More or less the basic thesis is the same. I was inspired to post it after hearing Michael Bloomberg claim on Meet the Press with Chuck Todd that being on target for the Paris climate goals was due to local municipalities remaining committed to the goals even though the Trump administration had not (Transcript). Of course, local municipalities are to be applauded for continuing to implement climate action plans that move us into a low CO2 emissions world. And, of course, action by local municipalities will enable us to meet the goals. But the data continue to suggest that it’s an economically motivated transition from coal to natural gas that is the real cause of this phenomenon.

Here is the original essay with one of the graphs updated:

The Clean Power Plan (CPP) was an Obama era EPA policy published in October, 2015, to reduce CO2 emissions from fossil fuel burning electrical power plants 32% relative to 2005 emissions by 2030. The plan required states to develop and implement emissions reduction plans. The CPP was a key plank in the US emission reduction goals presented at the 2015 Paris Climate Talks. The CPP came under immediate political fire and eventually enforcement was blocked by an action of the US Supreme Court. The Trump administration ordered a review the CPP which eventually led to its proposed repeal in October, 2017.

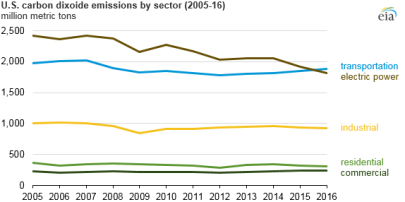
CO2 emissions in 2005 from the electric power sector were 2.4 billion tonnes. They will be around 1.7 billion tonnes by the end of 2017. This is a 29% reduction, already close to the 32% mandated for 2030. It appears that the goals of the CPP are being met without it ever having been implemented. Interestingly, in 2016 the transportation sector exceeded the electrical power sector as the sector responsible for the most emissions.


https://www.eia.gov/todayinenergy/detail.php?id=30712

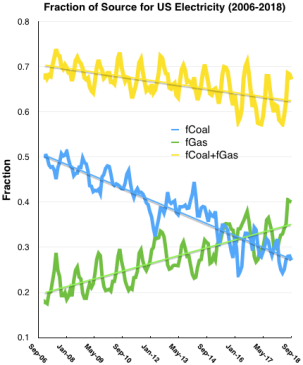
Two factors contribute. First, these reductions in CO2 emissions for the electrical power sector are due to the transition from coal to natural gas. See the accompanying chart “Fraction of Source for US Electricity.” In 2006 50% of electricity in the US came from coal-fired power plants, 20% from nuclear, 20% from natural gas-fired power plants, and the rest from renewable forms of energy. A dramatic shift occurred during the past decade where coal dropped to just under 30% and natural gas increased to nearly 35%. Nuclear remained at 20%. The total electricity demand remained constant throughout this period. The transition to natural gas produced a significant reduction in CO2 emissions. Natural gas produces less CO2 per unit energy than coal. For each kilojoule (kJ) of heat produced, natural gas produces 0.05 g CO2, whereas sub-bituminous coal produces 0.13 g CO2 and anthracite/bituminous coal produces 0.10 g CO2. Emissions are at least cut in half when natural gas replaces coal (assuming minimal leakage of gas in the transport system). Natural gas combined cycle systems are closer to 60% efficient whereas conventional coal plants are 40% efficient. A combined cycle natural gas turbine uses the heat from the initial combustion in the gas turbine to drive a second conventional steam turbine. Gas plants also burn cleaner.

The driving force for this transition, however, is not emissions reduction, but rather simple economic factors. Due to hydraulic fracturing, natural gas has become much more abundant and less expensive. Natural gas power plants are cheaper to build (~$1 billion/GW vs. ~$3 billion/GW for coal plants). Currently, there are only four coal-fired power plants being built in the US, and it appears that three of the four may not be completed. Even apart from the low price of natural gas, the cost of non-CO2 emissions controls (SOx, NOx, O3, Hg, and particulates), the uncertain regulatory climate, and the long-term investment makes a new coal plant a risky plan.

The second factor is the growth of renewable energy, especially windand solar PV. The accompanying chart shows that the fraction of coal plus natural gas has decreased by about 7%. A 7% increase in combined wind and solar offset this decrease. Nuclear and hydroelectric have not changed. Both wind and solar have seen a 10-fold increase in actual energy production in the past decade. Both are zero-emission sources. Energy production from wind and solar that replaces coal or natural gas will reduce CO2 emissions.

Where Do We Go from Here?

  • It seems that the doomsday predictions of those lamenting the repeal of the CPP are overstated. Let it die, and let the market continue to bring emissions down.
  • Let the market do what it will to conventional coal. As coal is replaced by natural gas and renewables, CO2 emissions will continue to drop. Funding for the re-training of coal industry workers should be made available.
  • The reaction of certain states and local municipalities to the CPP repeal and the planned withdrawal from the Paris climate agreement suggests that there is a commitment to these policies despite the Trump administration’s ambivalence. Perhaps the best solutions now are those that work with state and local regulators.

State of the World 2018

I gave a talk this summer at the annual meeting of the American Scientific Affiliation (ASA) on world energy needs in the year 2100 (audio | slides). One of my assumptions is that by 2100 all countries of the world will have the per capita energy use of a developed western European country (about 130 GJ per person). On a Human Development Index (HDI) vs. Per Capita Energy Use plot, 130 GJ corresponds to an HDI of over 0.9–in the highly developed category.

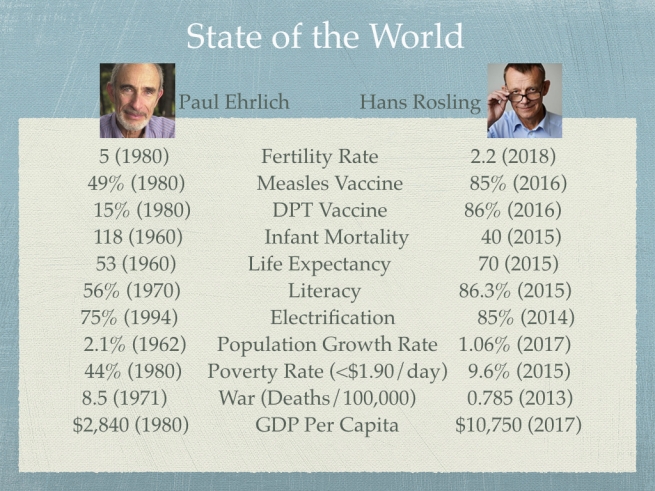
I was able to give a longer version of that talk at the Southern California section of the ASA that met at Cal Baptist University in January. In the longer version I took a minute to try to convince the audience that the world was indeed on a path of improvement. When I was an undergrad at Purdue and learning about the state of world in the late 70s, population was out of control, poverty was rampant, infant mortality was high, etc. Paul Ehrlich’s The Population Bomb and the Club of Rome’s Limits to Growth sent a very dire message about the future. While there are still many pessimistic messengers, it seems from more recent students of the state of world such as Hans Rosling of Gapminder.org that much progress has been made. See, for example, this video on population growth. Here’s the slide that contrasts Ehrlich and the 70s with Rosling and 2018.

The point of the paper is that world energy demands will be chiefly the result of global population growth (10 billion by 2050 and holding steady) and the development of the currently under-developed countries. This will produce a three-fold increase in global energy demand, from 550 EJ today to around 1600 EJ in 2010.

Review of Denis O. Lamoureux’s Evolution: Scripture and Nature Say Yes! and Some Thoughts Inspired by It

Lamoureux_CoverDenis O. Lamoureux’s argument in Evolution: Scripture and Nature Say Yes!  can be summarized in three points:

1. The end of either/or. We do not have to choose between creation and evolution. God could have created the universe, the earth, and life on earth using evolutionary processes.

2. The Bible is not a textbook of science. The Bible is concerned primarily with salvation history and is written to an ancient people in everyday language not in modern scientific language.

3. Embracing mainstream science. The arguments for evolution as a scientific theory explaining the diversity of life on earth are quite credible.

These three points, if grasped, put an end to the conflict between faith and science. Interestingly, the history of the American Scientific Affiliation, a network of Christians in the science, can be summarized by its recognition of these three points over the first several decades of its history. This is not to say that the rest of the book is unnecessary or a waste of time to read. Lamoureux elaborates each of these three points using a pedagogical approach that he has developed and perfected in over two decades of teaching about faith-science controversies in the college classroom. Interspersed, often at the end of each chapter, are glimpses of Lamoureux’s own journey from young-earth creationism to evolutionary creationism and comments that betray his vibrant evangelical Christian faith. Having known Denis for over 20 years it is a delight to hear his unapologetic testimony to his faith and his Lord.

Lamoureux calls “the end of either/or” the metaphysical-physical principle. Creation is a theological notion. Evolution is a scientific notion. That “the Bible is not a textbook of science” is captured in his message-incident principle. The inspired Scriptures are given to an ancient audience who share much of the view of the world that the rest of the ancient world had. God accommodated their ancient science, as Lamoureux calls it, and revealed his spiritual and saving truths to them using language and concepts that they used. The ancient science is incidental (and perhaps even false) compared to the eternally true and inerrant message of faith. Lamoureux presents some of the evidences for evolution from his own expertise as an evolutionary developmental biologist and as a dentist.

In Chapter 2 Lamoureux introduces the “two book metaphor” (the Bible and Nature as ways God reveals truth to us) and uses it ably throughout the book. Chapter 4 is an intriguing discussion of Intelligent Design where Lamoureux fully embraces intelligent design as an implication of God being the Creator, but he distances himself from the Intelligent Design Movement and sees the entire evolutionary creation process to be a most marvelous display of God’s intelligent design. Chapter 6 is a good typology of the range of origins perspectives: Young Earth Creation; Progressive Creative; Evolutionary Creation; Deistic Evolution; Dysteleological Evolution. Chapter 7 is a summary of the Galileo affair, which Lamoureux sees as the working out in astronomy 400 years ago the principles he is now applying to biology. Chapter 8 is a discussion of some of Darwin’s wrestling with theological matters surrounding his theory of biological evolution. Lamoureux clearly stops short of calling Darwin a Christian, but counters the anachronistic claims of the New Atheists that Darwin was one of them. Lamoureux seems to like some aspects of Darwin’s theology. More on that below. Chapter 9 is a wonderful sharing of some of his students’ responses to his guiding them through their faith-science struggles.

Quibbles

Although I agree with the substance of the book, think it reflects the right approach to faith-science conflicts, and will gladly recommend it to those wrestling with these issues, I have three minor quibbles. I will freely admit that my next comments are in the category of thoughts inspired by Lamoureux’s book rather than a review of the book itself. Nevertheless, the first two especially are integral to his general approach.

1) We say that the Bible is written in phenomenological language–the language of everyday appearances. The most famous example of this is the idea of the rising and setting of the sun. Indeed, in terms of every day experience this is how we perceive the world. We think of ourselves (and the earth) as stationary and the things in the sky as moving. This is how the world appeared to the ancients, and this is how the world appears to us. There is no difference between ancient phenomenological language and modern phenomenological language. This is how the world appears to a casual observer. It doesn’t matter that the ancients (up until Copernicus and Galileo) actually believed in geocentricism–which they did. It doesn’t matter that we don’t–most of us who are scientifically minded don’t. But the world appears this way to all people of all time.

This issue of phenomenological (or phenomenal) language is one in which I think we have gotten off track a bit. We see the idea in John Calvin in the 16th century, Charles Hodge in the 19th century, and many others since the church began to wrestle with faith-science questions. However, it was Bernhard Ramm’s The Christian View of Science and Scripture (1954) that brought the idea front and center to 20th century fundamentalists and evangelicals. I would encourage a re-reading of Section III, I entitled “The Language of the Bible in Reference to Natural Things” in Ramm’s book. It is a clear statement of the view that most of the Bible’s statements concerning the natural world are in the non-technical, common everyday language of appearances. Many of the faith-science problems disappear if we see the Bible as not speaking scientifically, but phenomenologically.

Recent discussions of this idea, including Lamoureux in this book, distinguish between ancient phenomenological language (the ancients believed what they saw was true) and modern phenomenological language (we know that things aren’t necessarily as they appear). In my opnion, this distinction guts the idea of its usefulness. Paul Seely in “Does the Bible Use Phenomenal Language?” (ASA 2009 Annual Meeting at Baylor University, http://www.asa3.org/ASAradio/ASA2009Seely.mp3) answers “there is probably no phenomenal language in the Bible” simply because he defines phenomenal language to be the language of appearance when we know it’s not really true. His answer really becomes question begging. By his definition, if the ancients believed what they saw was true then for them it was literal language and not phenomenal language. I say that this is an unnecessary and unhelpful restriction of the definition. Phenomenal language is the language of appearances. Period. It doesn’t matter whether it’s believed to be true or not. It is a description of what the world looks like. It doesn’t matter what cosmogony or scientific view the appearance is embedded in. What I see is the same thing that Moses saw.

Seely argues that even if the moving sun, moon, and stars is appearance, surely what the sun did at night is not an appearance since you can’t see it. But I disagree. The sun getting to its western setting (exiting) point back to its eastern rising point is an appearance. That traversing is an experienced phenomenon even though only the beginning and end points were observed. The underworld is that which is below the earth’s surface. The sun appears to go there at sunset and return from there the next morning. Note that it’s an appearance. Seely also complains that we are are not being faithful to historical-grammatical method of Biblical exegesis if we don’t use words the way they did. I don’t see how this is a problem. Their words are describing appearances, not what they believed about those appearances. It is irrelevant if they believed something different about them than what we believe. The intended message of the text is embedded in the common, everyday language of appearance. If we take the words in that sense then we are being true to the historical-grammatical method.

You can’t call phenomenological language true or false. It’s simply how the world appears. Lamoureux, Seely, and others seem too quick to find “false” things in the Bible. Their motive to relieve the tension between the Biblical view of the world and our modern scientific view of the world is laudable. But there’s no tension here if we understand how God is communicating to us in the Bible. The Bible isn’t making scientific claims and is merely communicating appearances in everyday language. There is no error here. Using everyday language is God’s accommodation. Consequently, his Word speaks to every time and place. I, for one, don’t want to be counted among those who rush to find false things in the Bible.

Less famous examples serve to illustrate. The ends of the earth. From the Oregon beach looking out toward the Pacific Ocean, it sure looks like I’ve reached the end of the earth. Only because of technical knowledge brought about by explorers, mapmakers, and the handful of humans who have been to outer space do I know otherwise. Both the ancients and we moderns experience that appearance.

After their own kinds. I’ve never once seen a hippopotamus give birth to a whale or vice versa. A hippo always gives birth to a hippo. Whales always give birth to whales. Everyday appearances tell me the same thing they told the ancients. I do not know about descent with modification because of every day appearances–it’s the result of a diligent and often counterintuitive process that we come to our scientific conclusions.

The bat as a bird. Birds are flying creatures. Bats fly like birds. We might even say they look like (appear to be) birds.

What about the firmament? (I’ll leave to the Hebrew scholars and the translators to decide between “solid dome” and “expanse”, but for now we’ll follow Lamoureux and Seely that it is a “solid dome”.) The sky is a solid dome across which the heavenly objects move. Is that ancient science or is that an appearance (phenomenological language). The sky looks like a dome to me, a modern. The sun, moon, and stars all move across that dome every day and night. Modern planetarium operators seem to think that there is a solid dome. They model the night sky with a miniature version of the solid dome. I would even go so far as to say that I only know that it’s not a dome because somebody told me in a science class. My everyday experience says it’s dome.

“1 In 4 Americans Thinks The Sun Goes Around The Earth, Survey Says” was the headline of an National Public Radio web article in 2014 (http://www.npr.org/sections/thetwo-way/2014/02/14/277058739/1-in-4-americans-think-the-sun-goes-around-the-earth-survey-says) based on a National Science Foundation report about science literacy and public attitudes about science. Aside from the massive failure of science education that this statistic suggests, it also suggests that the common sense view (the phenomenological view) is that the sun goes around the earth. In other words apart from technical knowledge obtained from a science education (most often from authority rather than from personal experience), many modern people (along with the ancients) believe what they see with their own eyes about geocentrism.

The point of it all is that the notion of phenomenological language (language of appearances) really does help us here. We can’t call it “wrong” or “erroneous” if it is an appearance. As for whether the ancients believed it or not, I only say that things aren’t always what they appear to be, but unless I have reason to say that things aren’t as they appear I have no real reason to think otherwise. My quibble is that I wish Lamoureux would stop using the term “ancient science” and simply use the term “phenomenological language”. There is no such thing as “ancient phenomenology”–appearances are appearances). The Bible is written in everyday language so that it works (mostly) for all people from a variety of times and places. We don’t need to rescue the Bible from errors that are only errors because we press the language to be scientific. In pressing the Bible to be speaking of “wrong” ancient science Lamoureux commits the very mistake he is urging us to avoid.

2) It is difficult for me to see the difference between Lamoureux’s theism and deism with respect to Nature. I have no doubt that Lamoureux is a theist. He believes that God is personally involved with and has a relationship with people. But he explicitly refers to two types of divine action: one that applies to God’s relationship with humans and one that applies to Nature. It’s the latter that is the source of my quibble. He uses “ordained and sustained” to described God’s works of origination and on-going involvement. But it seems to me that that’s not too far from the fabrication of and winding up of a deist’s designed clock and then letting it tick away. He seems to agree with Darwin’s deism with respect to Nature. God’s letting Nature take its course is an explanation for the problem of the Ichneumonidae wasp and the “suffering” of the caterpillar whose live body was food for the wasp larvae. Darwin used his distancing deism to solve what he perceived to be a moral problem if God was intimately involved (or micromanaged as Lamoureux derisively claims). The whole point of a reference to a fully gifted creation in this discussion is to say that God has equipped Nature to do what it does without interference from God. This view, as in the case of Darwin’s discussion of Ichneumonidae, allows God to be somewhat removed from the perceived nasty events functions as our answer to the problem of evil. Lamoureux seems to approve of Darwin’s move here. For Lamoureux it seems that the Nature operates deistically but God intervenes and is involved with the more personal touches: salvation history, personal salvation, revelation, miracles, and answers to prayer. It seems to me that a more direct providential involvement is necessitated even by the more personal touches because God often answers prayer and does miraculous things using quite ordinary means. Also, the Bible itself attributes much of the natural order to God’s direct activity. Divine governance needs to be added to ordaining and sustaining. God governs all his creatures and all their actions. Indeed, there is a sense in which God is a micromanager because he is actively involved in governing all things. I tell my students that God is as actively involved in turning water into wine at the wedding of Cana as he is in turning water into hydrogen gas and oxygen gas in a water electrolysis experiment. God’s micromanagement is personal and purposeful. It’s hard to understand why this is difficult to grasp if God is omnipotent, omniscience, and omnipresent. God is related to his Creation in a completely different manner than we are related to our “creations”. We tend to think analogically about God’s operations in the world based on how we interact with the world. But we’re not omnipotent, omniscience, or omnipresent. No aspect of Creation is autonomous. Even created agents need to be upheld in their being and in their ability to act. Theologians refer to a concurrence between the animating agency of God and the agency of the Creature. In my mind, the only way evolution produces the Creation God willed is because of this detailed active governance at every step of the way.

3) The final quibble is about the title: Evolution: Scripture and Nature Say Yes! I realize that this is a playful poke at Duane Gish’s Evolution: The Fossils Say No! and that it is possible that Lamoureux didn’t even have a choice in the matter. Lamoureux does explain in the last chapter how it takes both to understand reality. We need both books to understand the truth. They complement each other. No quibble with that. However, this title does some damage to one of the major theses of the book. Lamoureux rightly argues quite strongly that the Bible isn’t a textbook of science. Yet the title suggests that the Bible says “Yes!” to evolution. Perhaps it is meant simply to say that the Bible allows evolution as a scientific theory. No quibble with that either. But at face value I took it as a stronger claim that is confusing to the average reader. I have often been asked “Where does the Bible teach evolution?” My answer is always “It doesn’t!” The Bible teaches us a view of God, human beings, Creation, and God’s interaction with Creation that allows us to do science. When we study the Creation we conclude that evolution happened. Nothing in the Bible would lead us to that conclusion and, in fact, the Bible or its original audience isn’t really interested in whether or not evolution happened.

Back of the Envelope (3) – Batteries (Tesla Powerwall) to Store Renewables

Tesla_Powerwall

Tesla Powerwall (Image by Tesla Motors CC-I 4.0)


Summary: 375 MW of electricity is the amount currently provided by fossil fuel burning power plants for a population of about 320,000. To make this power with renewable sources (namely, solar PV) 2 GW must be generated: 375 MW for daytime use and 1.625 GW generated and stored for nighttime use. One option for storage is batteries. This amount of power can be produced by 1.5 million Tesla Powerwall (6.4 kWh) batteries. These could be distributed in residences and businesses with one Powerwall servicing roughly 460 square feet of building footprint. Alternatively, they could be housed in a few large warehouses following a more centralized utility model.

In the first Back of the Envelope we found that we need a 2 GW solar farm to replace the fossil fuel produced electricity currently used by a city such as Fort Collins, Loveland, Longmont, Estes Park, Colorado with a population of 320,000. 375 MW of that 2 GW will be used during the day and the rest, 1.625 GW, must be stored to be used at night. In the second Back of the Envelope we examined pumped hydro as the storage solution. While pumped hydro is the most prevalent form of storage today (99%), batteries are probably the most talked about solution to the storage problem. In this Back of the Envelope we will look at the solution offered by Tesla Motors with its Powerwall to see what level of implementation would be required to store the extra power produced by the 2 GW solar farm so we can make it through the night.

For this calculation we will use the home Powerwall, which is expected to cost $3000, can store up 6.4 kWh of electricity, and has dimensions of 33.9 inches x 51.2 inches x 7.1 inches (12,300 in3 or 0.2 m3). We need to store 1.625 GW x 6 hours or 9.75 GWh of electricity. That’s 9.75 million kWh. Divide that by the 6.4 kWh storage capacity of the Powerwall and you get 1.5 million Powerwall batteries taking up a volume of about 0.3 million m3 and costing $4.5 billion. If we can put them 6 high on a wall (about 8 m) in a warehouse that will require 37,500 m2 (400,000 square feet) of space. If we allowed 10x that space for access and cooling that would take up 375,000 m2 (4,000,000 square feet). That’s the size of about 20 large Walmart Supercenter buildings—not too bad for a utility scale centralized rollout. For such an installation we would probably use Tesla’s Powerpack or utility scale devices which have more capacity, but for this BOTE we will stick with the Powerwall batteries.

It is more likely that many or even most of these Powerwall devices will be distributed throughout town. The population density of Fort Collins is about 1000 people per km2; dividing 320,000 people by 1000 people per km2 gets us to  320 kmof area in Fort Collins, Loveland, Longmont, and Estes Park. Let’s assume that 20% of this is buildings (residences, businesses, schools, churches, etc.)—64 km2  (700 million square feet) of building footprint. If we need 1.5 million Powerwall batteries, that’s a Powerwall battery for every 460 square feet of building footprint.

  • An apartment with 1000 square feet needs one 1 or 2
  • An average size house of 2000 square feet needs 4 or 5
  • A church building with a 6000 square foot footprint needs 13
  • An office building with a 15,000 square foot footprint needs needs 30
  • A school building with a 140,000 square foot footprint needs 350

In its first year of production (2015-2016) Tesla plans to make around 100,000. 1.5 million are needed for the proposed 100% renewable solution. That’s 15 years worth just for Fort Collins. Obviously, that will need to scale up with an increased production rate and additional factories to make the devices. Because the “sample” city is only 1/1000 of the US population we will need 1.5 billion for the entire United States.

Lithium

Lithium floating on oil (Image by W. Oelen CC-BY-SA 3.0)

An estimate of the amount of lithium required is that 300 g Li metal is needed per 1 kWh of battery capacity. (Theoretical electrochemical considerations give a value of about 75 g Li per kWh; here we have multiplied by 4 to give a more realistic “real world” value.) Thus the 6.4 kWh Powerwall requires about 2 kg Li. For the 1.5 million needed in Fort Collins that’s 3.0 million kg of Li or 3,000 metric tonnes (3 million metric tonnes for the whole country). Global annual production of lithium is around 37,000 metric tonnes of lithium. Currently, only about 30% of the produced lithium is used for batteries (portable tools, laptops, cell phones, and the nascent electric vehicle (EV) market). A full, nation-wide rollout of this new market for batteries involves a 80x increase in the production of lithium. Of course, the EV market is also rapidly growing. A transition to EV of the over 250 million passenger vehicles in the US today, each one using 10x as much lithium as a Powerwall battery, would put significant pressure not only on lithium production but also on global reserves of lithium. The USGS estimates that there are 13 million metric tonnes of known reserves (i.e. currently economically obtainable) and only 39 million metric tonnes of lithium existing on the planet. For more information about lithium supply limits see this article from Green Tech Media. Perhaps a more serious resource limitation is the rare earth metals used in the DC to AC inverters. We’ll save that discussion for another BOTE.

The solar farm discussed in the first BOTE is already going to cost $2.5 billion with probably a 20 year lifetime. 1.5 million Powerwall batteries will cost another $4.5 billion. However, these only have a 10 year lifetime. Let’s say $5.75 billion for 2 GW of electricity for 10 years:

2 GW x 6 hr/day x 365 days/year x 10 years = 43,800 GWh = 43.8 billion kWh

The price of this electricity (not counting operation and maintenance) is $5.75 billion/43.8 billion kWh = $0.13/kWh–a bit pricey, but not far off from today’s prices. No doubt the price of batteries will go down as production scales go up, as technology improves, and with business and utility scale models incorporated into the implementation.

The most serious limitation at this point in time seems to be the rate of lithium production and the rate of battery production.

Check out Energy: What the World Needs Now by Terry M. Gray and Anthony K. Rappé.

Back of the Envelope (2) – Pumped Hydro to Store Renewables

Summary: 375 MW of electricity is the amount currently provided by fossil fuel burning power plants for a population of about 320,000. To make this power with renewable sources (namely, solar PV) 2 GW must be generated: 375 MW for daytime use and 1.625 GW generated and stored for nighttime use. One option for storage is pumped hydroelectric power. This amount of power can be produced hydroelectrically by draining a reservoir (such as Horsetooth Reservoir near Fort Collins, Colorado) of 120 million m3 of water at night and pumping it back during the daytime. This would involve creating a lake downstream from the reservoir 6 m (20 ft) deep and 6 km (3-4 mi) on each side. Alternatively, 377 pairs of large tanks (500 ft in diameter 100 ft tall) slightly larger than the oil storage tanks located in Cushing, Oklahoma, one above ground and one below ground, could be filled and drained each day. Each tank takes up about 5 acres or just a bit more than 2 city blocks.

In the first Back of the Envelope we found that we need a 2 GW solar farm to replace the fossil fuel produced electricity currently used by a city such as Fort Collins, Loveland, Longmont, Estes Park, Colorado with a population of 320,000. 375 MW of that 2 GW will be used during the day and the rest, 1.625 GW must be stored to be used at night.  The only form of energy storage reported by the Energy Information Administration is pumped hydroelectric power. “Pumped hydro” is the only large-scale energy storage in use today–99% of all storage is pumped hydro. Water is pumped into a reservoir using excess energy production and then released later to generate electricity as in a hydroelectric power plant. Some pumped hydro facilities were developed in concert with nuclear power facilities. When power production exceeded demand, the excess was used to pump water into a reservoir rather than throttle the  amount of electricity produced by the nuclear power plant. This allows the nuclear power plant to operate an optimal level. This Back of the Envelope post will explore what would be required to provide overnight storage of daytime generated electricity using pumped hydro.

The important physics/engineering equation is that which calculates the power available in a reservoir of water. The equation is

Power (Watts) =
Efficiency x density of water (kg/m3) x flow rate (m3/s) x force of gravity (m/s2) x height (m)

Horsetooth Reservoir

Horsetooth Reservoir near Fort Collins, Colorado (Photo from the US Department of Interior Bureau of Reclamation)

Efficiency is the efficiency of conversion of hydropower to electrical power. We’ll assume 80%. The density of water is 1000 kg/m3. The force of gravity is 9.81 m/s2; we’ll call it 10 m/s2. The height will depend on our exact system. We’ll explore a couple of options.

Option 1: Horsetooth Reservoir

Horsetooh Reservoir is less than a mile away from the western edge of Fort Collins. There are four earthen dams that make up the reservoir. The reservoir holds 0.2 km3 (200 million m3, 157,000 acre-ft) of water. At the north end is a dam that is 155 feet high. How much electricity could we generate if we let the water out? In order to pump it back we have to store the water downstream somewhere. We’ll talk about that later. Let’s estimate the water level behind the dam to be 50 meters higher than in front of the dam. However, as we’ll see we will be changing that height significantly as the water is released even in a large reservoir like Horsetooth. (Technically, we should integrate as the water is released, but as a first approximation we’ll do the calculation using a static height of 1/2 of the initial height.) Let’s say that our actual head height is 25 meters. Now we can plug numbers into our equation. We need 375 MW of power.

375 x 106 W = 0.8 x 1000 kg/m3 x flow rate (m3/s) x 10 m/s2 x 25 m

Solving for flow rate gives us 1875 m3/s. We need to do this for 18 hours. 18 hours is 64,800 seconds.

Total volume needed is 1875 m3/s x 64,800 s = 121 million m3.

This is 60% of Horsetooth Reservoir drained out every night and pumped back in during the day. A flow rate of 1875 m3/s is comparable to the flow rate out of other large scale hydroelectric plants. Three 6-7 m (20 feet) diameter pipes could do the trick. Pumping the released water back during the daytime needs to occur 3x faster. The giant pumps that are being installed in New Orleans since Katrina can pump at near 625 m3/s. We would need nine of these monsters each costing $0.5 billion to pump all the water back each day.

Another problem is where to put the water. Without worrying for now about land use issues, let’s make a shallow lake downstream from the main dam. If it is 6 meters (20 ft) deep, we need a 33 million m2 area (33 km2,  82,000 acres). That’s a shallow lake 6 km or 3-4 miles on a side. Interestingly, that’s the size of the solar farm needed. Perhaps we can float the solar panels on the lake.

Option 2: Storage Tank Farm

Cushing, Oklahoma oil tank

An Enbridge oil tank at Cushing, Oklahoma (Photo by roy.luck CC-BY-SA 2.0)

The previous solution requires a specific geographical setting that may only be appropriate for certain locations, and since Horsetooth Reservoir is also a recreational facility, we may not want to drain it every night. Is there a way to make this work anywhere with artificial storage tanks? The oil storage facility in Cushing, Oklahoma comes to mind. What if we built large water storage tanks, one above ground and one below ground? What would it take to store enough power to get through the night? The largest of these tanks run about 400 feet in diameter and 70 feet tall. Let’s say we can stretch the limits a bit and get to 500 feet in diameter and 100 feet tall. That would be 150 meters in diameter and 30 meters tall. Each tank holds 530,000 m3 of water. The average height between the levels of water is now only 15 meters (rather than the 25 meters we had for Horsetooth Reservoir). Since we have only 60% of the head, we need 1.67x as much water. Using the number from the previous calculation (121 million m3) this gives us 200 million m3 of water.

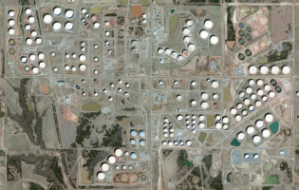
Cushing, Oklahoma Oil Tank Farms

A satellite image of the Cushing, Oklahoma oil storage tank farms. The image is about 2 miles horizontal and 1.5 miles vertical.

At 530,000 m3 per pair of tanks, that means 377 pairs of tanks. Each tank takes up a 150 m x 150 m square (about 5 acres or 4 football fields or just over 2 city blocks). This ends up being a 10 km x 10 km (6 mi x 6 mi) water storage tank farm. That area is comparable to the area of Horsetooth Reservoir and the downstream lake that was created.

Feasible?

Either project is grandiose. And keep in mind that we have to do this times 1000 for the US alone. However, such projects are not necessarily engineering impossibilities. Geography might help in many instances. Coastal regions or those near the Great Lakes might be able to use the ocean or lake as the lower level storage tank. The bottom line is that this would be a massive enterprise. On the surface it looks doable, but the scale of the project makes it seem like other options might be better. These will be discussed in future BOTE blog posts.

Check out Energy: What the World Needs Now by Terry M. Gray and Anthony K. Rappé.

Back of the Envelope (1) – How Much Solar Do We Need?

Summary: 375 MW of electricity, an amount currently provided by fossil fuel burning power plants for a population of about 320,000, requires a 2 GW solar farm composed of 5 million 200 W/msolar panels taking up 10 km2 (4 mi2) or 2500 acres of land (just under 1/10 the area of a city of 150,000 such as Fort Collins, Colorado). This will cost nearly $2.5 billion to construct and, if amortized over 20 years, will add $0.03 per kWh to the operational cost of electricity. This assumes some storage technology is available and takes into account intermittency and losses from storage.

Back of the Envelope is a blog series exploring issues related to transitioning from fossil fuel based electricity to renewable electricity production. There are two big issues: first, the scale, i.e. how many  renewable energy sources are needed to replace the fossil fuel sources currently in use; second, because of intermittency issues, i.e. that the sun doesn’t shine at night or that the wind doesn’t blow all the time, extra energy needs to be produced during production times and storage needs to be developed.

I am from Fort Collins, Colorado. Fort Collins gets its electricity from the Platte River Power Authority (PRPA), a public power utility that services Loveland, Longmont, and Estes Park in addition to Fort Collins. The total population served is nearly 320,000. This is a nice number because it represents approximately 1/1000 of the US population. Roughly speaking, we need to multiply whatever we find here by 1000 to cover the whole United States.

PRPA’s sources include coal (about 75%), hydropower (about 20%), wind (about 5%), and some other sources including natural gas for summer peak demand. The daily load profile is typical with a peak load around 7pm and a low around 3am. The average daily load for January 2016 is around 400 MW. Let’s call it 500 MW to account for summer load and in the spirit of a back-of-the-envelope calculation.

Some of PRPA’s energy (25%) already comes from renewable sources. Nationwide the number is between 10% and 15%, but is nearly 35% if you include nuclear. For this calculation I will assume that we need 75% of 500 MW, 375 MW, to replace the fossil fuel sources. I will also do the calculation using solar PV only. Obviously, a real solution will be a combination of solar PV, solar thermal (CSP), and wind. But the land use/resource requirements are similar among the three, so we can get our back-of-the-envelope result by just using solar PV.

Here’s where we’re heading. We need to meet the daytime load. We will assume that daytime is 6 hours per day (a 25% capacity factor). (Perhaps with a combination of wind and solar we could get up to 8 hours per day (closer to a 35% capacity factor).) We will need to produce enough energy while the sun is shining brightly to cover the 18 hours when it’s not. This will be produced during the day and stored somehow. Since storage will not be 100% efficient, we will need to produce additional energy to account for a round trip efficiency, which we assume to be 75%.

Daytime Load

Let’s be generous with our solar panel efficiency and say we can have 200 W/m2 solar panels. That would be a 400 W 1 m x 2 m panel (2 m2 panels).

375 MW x 1,000,000 W/MW x 1 solar panel/400 W = 937,500 panels. Let’s just call it 1,000,000. A million solar panels takes up 2 million m2 of space. A km2 is 1,000,000 m2 so we’re talking 2 km2 (0.77 mi2). That’s a square of land 1.4 km (0.9 mi) on a side. If you think in acres, that’s about 500 acres.

Nighttime Load

We have to multiply everything times 3 to cover when the sun is not shining. So that’s 3 million more solar panels taking up 6 km2 (2.3 mi2) or 1500 acres.

Storage Efficiency Issues

Since the nighttime load has to be stored we will have to increase our numbers to accommodate inefficiencies in round trip storage. Since our efficiency is assumed to be 75% we can divide our nighttime load numbers by 0.75 to get the amount that needs to be stored:  4 million solar panels taking up 8 km2 (3 mi2) or 2000 acres.

Totals

Adding in the daytime load now gives a total of 5 million solar panels and 10 km2 (4 mi2) or 2500 acres. That’s a 2 GW solar farm.

The area of the city of Fort Collins is 56 mi2 so we’re talking about covering an area equivalent to 7% of the entire city with solar panels. These solar panels cost about $200 per panel for a home installation. Since we’re buying 5 million of them, let’s say we can get half off for a total cost of $500,000,000. If we estimate $2/W for installation that’s an additional $2 billion for a total of $2.5 billion.

Assuming our 2 GW solar farm produces electricity for 6 hours a day, 365 days a year for 20 years, we will produce 2 GW x 1,000,000 kW/GW x 6 hours/day x 365 days/year x 20 years = 87.6 billion kWh. That would be $0.03/kWh to cover the initial building of the solar farm. While that’s a lot of money up front, over the long run it’s a decent construction cost per kWh of electricity produced.

The largest solar PV plants in the US today are around 500 MW (Solar Star, Topaz, Desert Sunlight, Copper Mountain) each costing in the $2-$3 billion range. Prices of solar installations continue to come down, so it’s conceivable that we could get a 4x larger plant for nearly the same price.

The general result is that if we switch from fossil fuel sources to intermittent sources with storage that we need to a solar or wind facility that produces 5x the amount of electricity that we get from the fossil fuel plant. In order to make this work we need to store that electricity somehow, not a trivial problem today. We’ll discuss that in future Back of the Envelope posts. And, remember, we need 1000 of these nationwide.

Check out Energy: What the World Needs Now by Terry M. Gray and Anthony K. Rappé.

Age of the Earth

age of the earth icon

This is the fifth of a series of posts introducing Resources on Science and Christian Faith from the American Scientific Affiliation (ASA). These blog posts are based on the introductory essays that accompany each of the topics. Today we are using the topic of the Age of the Earth.

Using radiometric dating modern science has concluded that the earth is 4.54 billion years old. Geologists since the 18th and 19th centuries began to understand that the earth has a vast age (measured in millions and billions of years rather than thousands of years). The 17th century bishop, James Ussher, using dates of historically known events and assuming literal and gapless Biblical genealogies and an ordinary (six, twenty-four hour day) Creation week in Genesis 1, concluded that God created the world around six thousand years ago. Today’s young-earth creationists (YEC) continue to follow Ussher’s basic interpretative procedure. Others (old earth creationists, theistic evolutionists/evolutionary creationists, some Old Testament scholars) believe that there are approaches to understanding Genesis 1 in particular that do not require a conclusion that is in conflict with modern science. (See the “Reading Genesis” section for various perspectives.)

Most ASA members accept the consensus scientific view on the age of the earth. Already in 1949 based on radiometric dating techniques, ASA member Laurence Kulp said, “One of the most probable facts in geology, I believe, is that the earth is close to two billion years old…” Kulp’s early paper supporting the old earth position and criticizing YEC is featured in the collection below. A paper written for the ASA web site, “Radiometric Dating: A Christian Perspective” by physicist Roger Wiens has proved to be one of the most popular in terms of electronic downloads. Many of the resources here simply review the scientific claims for an old earth and then seek to understand that great age in light of what the Bible says. YEC have brought forward critiques of the various dating methods and conclusions drawn from them. Because ASA members have tended to accept the consensus view, the articles here summarize and engage the YEC criticisms. ASA members may disagree with the YEC position but acknowledge those who hold that view as fellow believers and worthy of respectful engagement. Randy Isaac’s review of the YEC RATE project and subsequent dialog with its authors illustrates this respectful engagement.

Many Christians today, especially those in conservative, evangelical churches, remain persuaded of the YEC viewpoint. Yet there are evangelical traditions and theologians who have long accepted old earth arguments. ASA members throughout its history have sought to convince the former group that the scientific arguments for an old earth are quite sound, rooted in the same science that has given us progress in medicine and technology. Largely evangelical themselves, these ASA members have also attempted to formulate ways of approaching this question that take seriously the Bible and evangelical Christian theology.

The last group of papers deals with the idea of apparent age. Here, the earth/universe looks old, i.e. old age is the conclusion you would draw from the scientific data. Even Isaac, in his discussion of the RATE project, seems to allow this view as one with scientific integrity because it admits to the consensus view. Many reject the view because it undermines the idea that we can draw reliable conclusions from our observations or even trust God’s revelation to us in creation. Nonetheless, apparent age is a method of reconciling the scientific data with the perceived need for a young earth.

Anyone interested in tackling the scientific arguments for the vast age of the earth or the related theological questions is encouraged to study these papers and talks.

Questions

1. What have you been taught about the age of the earth in your family, church, or school?

2. Which scientific arguments for an old earth do you know?


Reading Genesis

reading genesis icon

This is the fourth of a series of posts introducing Resources on Science and Christian Faith from the American Scientific Affiliation (ASA). These blog posts are based on the introductory essays that accompany each of the topics. Today we are using the topic of Reading Genesis.

For some the Bible-Science conflict starts with the opening chapter of Genesis. If one assumes that the account is straight-forward narrative depicting a strict chronological sequence then you end up with a fully formed Creation that was made in the space of six (twenty-four hour) days. If you tie such a view to a historical dating of the David/Solomonic kingdom around 1000 BC and an arithmetic (rather than symbolic) approach to the genealogies of the Bible, you end up with a recent Creation, 6,000 to 10,000 years ago. This is how many evangelicals read Genesis today and is the origin of such young-earth creationist (YEC) organizations as the Institute for Creation Research, the Creation Research Society, Answers in Genesis, etc. In this view the Bible teaches a recent Creation. All other approaches to knowledge (science, history, etc.) must conform to this Biblical teaching.

This YEC viewpoint seems at odds with the conclusions of modern science. Modern cosmology teaches that the universe is 13.8 billion years old, that the earth is 4.54 billion years old, that life originated on earth 3.85 billion years ago, that modern plants and animals developed through an evolutionary process around 500 million years ago, that dinosaurs lived on the earth 230 million to 70 million years ago, that modern humans have been around for 200,000 years, and that worldwide migrations of humans occurred 60,000 to 15,000 years ago. This long history embodies cosmological, geological, and biological processes that occurred over time-scales in the thousands, millions, and billions of years, not six, twenty-four hour days.

There are others who embrace the scientific account and then conclude that the Bible and the religions that use the Bible as their authoritative text are hopelessly wrong. For them Biblical faith is akin to believing in fairies and leprechauns. While coming from totally opposite perspectives YEC and atheistic evolutionists have a fundamental agreement: Biblical faith and modern science are incompatible. Yet, there are some, represented by the American Scientific Affiliation and the BioLogos Foundation, the developers and hosts of the perspectives presented here, who disagree. By and large those who disagree do not reject the conclusions of modern science. Thus, the chronology of modern science stated above is accepted as well as the idea that naturally occurring processes can explain the historical development of the cosmos from Big Bang to present. Accepting the conclusions of modern science can be done from Christian theistic framework. God remains the Creator, Sustainer, Governor, and Provider of the universe.

Those who adopt this middle path claim that it is possible to understand the Bible in a way that does not result in a conflict with modern science. Many wonder whether this is being faithful to scripture. This question is addressed in all of the papers and presentations listed below. While it is certainly true that those who accept the authority of the Bible should not always adjust their interpretation of scripture to fit the results of the latest science, it must always be remembered that our traditional interpretations may be wrong. If a conflict with science arises, there is nothing wrong with using that occasion to revisit our traditional interpretation of scripture to see if we have it right. Most everyone would admit that if the traditional interpretation is not the correct interpretation then we should change our view, and that changing our view is being more faithful to scripture.

Listed below are key papers from the ASA journal (JASA, PSCF) or presentations given at ASA meetings or other works by individuals associated with the ASA that address the proper way of reading Genesis 1. Not all of the authors agree with each other. But there is somewhat a common theme that Genesis 1 must be understood in the Ancient Near Eastern (ANE) context and that reading it in that context may mean that our 21st century questions may not be answered.

Questions

1. How were you brought up to understand Genesis 1? What did you learn at home, in Sunday School, in church, at school, in college? Is challenging the “traditional” reading of Genesis 1 troubling to you?

2. How does your current Christian community–your church, your Christian school, your Christian college–deal with these issues?

3. How well do you understand modern science and its claims about the origin of the universe, the earth, life on earth, and humanity?

4. Have you ever changed your understanding of scripture based on extra-Biblical information (archaeology, understanding Biblical customs, etc.)? Why did you change your view?

5. How might it be possible to reject Genesis as straight-forward narrative depicting a strict chronological sequence and not reject it being revelation from God and having some kind of authority?