Let It Die––A Response to the Proposed Repeal of the Clean Power Plan

About a year ago I wrote the following essay but it was never published anywhere. More or less the basic thesis is the same. I was inspired to post it after hearing Michael Bloomberg claim on Meet the Press with Chuck Todd that being on target for the Paris climate goals was due to local municipalities remaining committed to the goals even though the Trump administration had not (Transcript). Of course, local municipalities are to be applauded for continuing to implement climate action plans that move us into a low CO2 emissions world. And, of course, action by local municipalities will enable us to meet the goals. But the data continue to suggest that it’s an economically motivated transition from coal to natural gas that is the real cause of this phenomenon.

Here is the original essay with one of the graphs updated:

The Clean Power Plan (CPP) was an Obama era EPA policy published in October, 2015, to reduce CO2 emissions from fossil fuel burning electrical power plants 32% relative to 2005 emissions by 2030. The plan required states to develop and implement emissions reduction plans. The CPP was a key plank in the US emission reduction goals presented at the 2015 Paris Climate Talks. The CPP came under immediate political fire and eventually enforcement was blocked by an action of the US Supreme Court. The Trump administration ordered a review the CPP which eventually led to its proposed repeal in October, 2017.

CO2 emissions in 2005 from the electric power sector were 2.4 billion tonnes. They will be around 1.7 billion tonnes by the end of 2017. This is a 29% reduction, already close to the 32% mandated for 2030. It appears that the goals of the CPP are being met without it ever having been implemented. Interestingly, in 2016 the transportation sector exceeded the electrical power sector as the sector responsible for the most emissions.


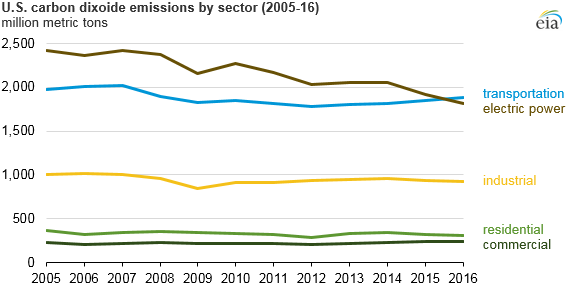
https://www.eia.gov/todayinenergy/detail.php?id=30712

Two factors contribute. First, these reductions in CO2 emissions for the electrical power sector are due to the transition from coal to natural gas. See the accompanying chart “Fraction of Source for US Electricity.” In 2006 50% of electricity in the US came from coal-fired power plants, 20% from nuclear, 20% from natural gas-fired power plants, and the rest from renewable forms of energy. A dramatic shift occurred during the past decade where coal dropped to just under 30% and natural gas increased to nearly 35%. Nuclear remained at 20%. The total electricity demand remained constant throughout this period. The transition to natural gas produced a significant reduction in CO2 emissions. Natural gas produces less CO2 per unit energy than coal. For each kilojoule (kJ) of heat produced, natural gas produces 0.05 g CO2, whereas sub-bituminous coal produces 0.13 g CO2 and anthracite/bituminous coal produces 0.10 g CO2. Emissions are at least cut in half when natural gas replaces coal (assuming minimal leakage of gas in the transport system). Natural gas combined cycle systems are closer to 60% efficient whereas conventional coal plants are 40% efficient. A combined cycle natural gas turbine uses the heat from the initial combustion in the gas turbine to drive a second conventional steam turbine. Gas plants also burn cleaner.

The driving force for this transition, however, is not emissions reduction, but rather simple economic factors. Due to hydraulic fracturing, natural gas has become much more abundant and less expensive. Natural gas power plants are cheaper to build (~$1 billion/GW vs. ~$3 billion/GW for coal plants). Currently, there are only four coal-fired power plants being built in the US, and it appears that three of the four may not be completed. Even apart from the low price of natural gas, the cost of non-CO2 emissions controls (SOx, NOx, O3, Hg, and particulates), the uncertain regulatory climate, and the long-term investment makes a new coal plant a risky plan.

The second factor is the growth of renewable energy, especially windand solar PV. The accompanying chart shows that the fraction of coal plus natural gas has decreased by about 7%. A 7% increase in combined wind and solar offset this decrease. Nuclear and hydroelectric have not changed. Both wind and solar have seen a 10-fold increase in actual energy production in the past decade. Both are zero-emission sources. Energy production from wind and solar that replaces coal or natural gas will reduce CO2 emissions.

Where Do We Go from Here?

  • It seems that the doomsday predictions of those lamenting the repeal of the CPP are overstated. Let it die, and let the market continue to bring emissions down.
  • Let the market do what it will to conventional coal. As coal is replaced by natural gas and renewables, CO2 emissions will continue to drop. Funding for the re-training of coal industry workers should be made available.
  • The reaction of certain states and local municipalities to the CPP repeal and the planned withdrawal from the Paris climate agreement suggests that there is a commitment to these policies despite the Trump administration’s ambivalence. Perhaps the best solutions now are those that work with state and local regulators.

State of the World 2018

I gave a talk this summer at the annual meeting of the American Scientific Affiliation (ASA) on world energy needs in the year 2100 (audio | slides). One of my assumptions is that by 2100 all countries of the world will have the per capita energy use of a developed western European country (about 130 GJ per person). On a Human Development Index (HDI) vs. Per Capita Energy Use plot, 130 GJ corresponds to an HDI of over 0.9–in the highly developed category.

I was able to give a longer version of that talk at the Southern California section of the ASA that met at Cal Baptist University in January. In the longer version I took a minute to try to convince the audience that the world was indeed on a path of improvement. When I was an undergrad at Purdue and learning about the state of world in the late 70s, population was out of control, poverty was rampant, infant mortality was high, etc. Paul Ehrlich’s The Population Bomb and the Club of Rome’s Limits to Growth sent a very dire message about the future. While there are still many pessimistic messengers, it seems from more recent students of the state of world such as Hans Rosling of Gapminder.org that much progress has been made. See, for example, this video on population growth. Here’s the slide that contrasts Ehrlich and the 70s with Rosling and 2018.

The point of the paper is that world energy demands will be chiefly the result of global population growth (10 billion by 2050 and holding steady) and the development of the currently under-developed countries. This will produce a three-fold increase in global energy demand, from 550 EJ today to around 1600 EJ in 2010.

Back of the Envelope (3) – Batteries (Tesla Powerwall) to Store Renewables

Tesla_Powerwall

Tesla Powerwall (Image by Tesla Motors CC-I 4.0)


Summary: 375 MW of electricity is the amount currently provided by fossil fuel burning power plants for a population of about 320,000. To make this power with renewable sources (namely, solar PV) 2 GW must be generated: 375 MW for daytime use and 1.625 GW generated and stored for nighttime use. One option for storage is batteries. This amount of power can be produced by 1.5 million Tesla Powerwall (6.4 kWh) batteries. These could be distributed in residences and businesses with one Powerwall servicing roughly 460 square feet of building footprint. Alternatively, they could be housed in a few large warehouses following a more centralized utility model.

In the first Back of the Envelope we found that we need a 2 GW solar farm to replace the fossil fuel produced electricity currently used by a city such as Fort Collins, Loveland, Longmont, Estes Park, Colorado with a population of 320,000. 375 MW of that 2 GW will be used during the day and the rest, 1.625 GW, must be stored to be used at night. In the second Back of the Envelope we examined pumped hydro as the storage solution. While pumped hydro is the most prevalent form of storage today (99%), batteries are probably the most talked about solution to the storage problem. In this Back of the Envelope we will look at the solution offered by Tesla Motors with its Powerwall to see what level of implementation would be required to store the extra power produced by the 2 GW solar farm so we can make it through the night.

For this calculation we will use the home Powerwall, which is expected to cost $3000, can store up 6.4 kWh of electricity, and has dimensions of 33.9 inches x 51.2 inches x 7.1 inches (12,300 in3 or 0.2 m3). We need to store 1.625 GW x 6 hours or 9.75 GWh of electricity. That’s 9.75 million kWh. Divide that by the 6.4 kWh storage capacity of the Powerwall and you get 1.5 million Powerwall batteries taking up a volume of about 0.3 million m3 and costing $4.5 billion. If we can put them 6 high on a wall (about 8 m) in a warehouse that will require 37,500 m2 (400,000 square feet) of space. If we allowed 10x that space for access and cooling that would take up 375,000 m2 (4,000,000 square feet). That’s the size of about 20 large Walmart Supercenter buildings—not too bad for a utility scale centralized rollout. For such an installation we would probably use Tesla’s Powerpack or utility scale devices which have more capacity, but for this BOTE we will stick with the Powerwall batteries.

It is more likely that many or even most of these Powerwall devices will be distributed throughout town. The population density of Fort Collins is about 1000 people per km2; dividing 320,000 people by 1000 people per km2 gets us to  320 kmof area in Fort Collins, Loveland, Longmont, and Estes Park. Let’s assume that 20% of this is buildings (residences, businesses, schools, churches, etc.)—64 km2  (700 million square feet) of building footprint. If we need 1.5 million Powerwall batteries, that’s a Powerwall battery for every 460 square feet of building footprint.

  • An apartment with 1000 square feet needs one 1 or 2
  • An average size house of 2000 square feet needs 4 or 5
  • A church building with a 6000 square foot footprint needs 13
  • An office building with a 15,000 square foot footprint needs needs 30
  • A school building with a 140,000 square foot footprint needs 350

In its first year of production (2015-2016) Tesla plans to make around 100,000. 1.5 million are needed for the proposed 100% renewable solution. That’s 15 years worth just for Fort Collins. Obviously, that will need to scale up with an increased production rate and additional factories to make the devices. Because the “sample” city is only 1/1000 of the US population we will need 1.5 billion for the entire United States.

Lithium

Lithium floating on oil (Image by W. Oelen CC-BY-SA 3.0)

An estimate of the amount of lithium required is that 300 g Li metal is needed per 1 kWh of battery capacity. (Theoretical electrochemical considerations give a value of about 75 g Li per kWh; here we have multiplied by 4 to give a more realistic “real world” value.) Thus the 6.4 kWh Powerwall requires about 2 kg Li. For the 1.5 million needed in Fort Collins that’s 3.0 million kg of Li or 3,000 metric tonnes (3 million metric tonnes for the whole country). Global annual production of lithium is around 37,000 metric tonnes of lithium. Currently, only about 30% of the produced lithium is used for batteries (portable tools, laptops, cell phones, and the nascent electric vehicle (EV) market). A full, nation-wide rollout of this new market for batteries involves a 80x increase in the production of lithium. Of course, the EV market is also rapidly growing. A transition to EV of the over 250 million passenger vehicles in the US today, each one using 10x as much lithium as a Powerwall battery, would put significant pressure not only on lithium production but also on global reserves of lithium. The USGS estimates that there are 13 million metric tonnes of known reserves (i.e. currently economically obtainable) and only 39 million metric tonnes of lithium existing on the planet. For more information about lithium supply limits see this article from Green Tech Media. Perhaps a more serious resource limitation is the rare earth metals used in the DC to AC inverters. We’ll save that discussion for another BOTE.

The solar farm discussed in the first BOTE is already going to cost $2.5 billion with probably a 20 year lifetime. 1.5 million Powerwall batteries will cost another $4.5 billion. However, these only have a 10 year lifetime. Let’s say $5.75 billion for 2 GW of electricity for 10 years:

2 GW x 6 hr/day x 365 days/year x 10 years = 43,800 GWh = 43.8 billion kWh

The price of this electricity (not counting operation and maintenance) is $5.75 billion/43.8 billion kWh = $0.13/kWh–a bit pricey, but not far off from today’s prices. No doubt the price of batteries will go down as production scales go up, as technology improves, and with business and utility scale models incorporated into the implementation.

The most serious limitation at this point in time seems to be the rate of lithium production and the rate of battery production.

Check out Energy: What the World Needs Now by Terry M. Gray and Anthony K. Rappé.

Back of the Envelope (2) – Pumped Hydro to Store Renewables

Summary: 375 MW of electricity is the amount currently provided by fossil fuel burning power plants for a population of about 320,000. To make this power with renewable sources (namely, solar PV) 2 GW must be generated: 375 MW for daytime use and 1.625 GW generated and stored for nighttime use. One option for storage is pumped hydroelectric power. This amount of power can be produced hydroelectrically by draining a reservoir (such as Horsetooth Reservoir near Fort Collins, Colorado) of 120 million m3 of water at night and pumping it back during the daytime. This would involve creating a lake downstream from the reservoir 6 m (20 ft) deep and 6 km (3-4 mi) on each side. Alternatively, 377 pairs of large tanks (500 ft in diameter 100 ft tall) slightly larger than the oil storage tanks located in Cushing, Oklahoma, one above ground and one below ground, could be filled and drained each day. Each tank takes up about 5 acres or just a bit more than 2 city blocks.

In the first Back of the Envelope we found that we need a 2 GW solar farm to replace the fossil fuel produced electricity currently used by a city such as Fort Collins, Loveland, Longmont, Estes Park, Colorado with a population of 320,000. 375 MW of that 2 GW will be used during the day and the rest, 1.625 GW must be stored to be used at night.  The only form of energy storage reported by the Energy Information Administration is pumped hydroelectric power. “Pumped hydro” is the only large-scale energy storage in use today–99% of all storage is pumped hydro. Water is pumped into a reservoir using excess energy production and then released later to generate electricity as in a hydroelectric power plant. Some pumped hydro facilities were developed in concert with nuclear power facilities. When power production exceeded demand, the excess was used to pump water into a reservoir rather than throttle the  amount of electricity produced by the nuclear power plant. This allows the nuclear power plant to operate an optimal level. This Back of the Envelope post will explore what would be required to provide overnight storage of daytime generated electricity using pumped hydro.

The important physics/engineering equation is that which calculates the power available in a reservoir of water. The equation is

Power (Watts) =
Efficiency x density of water (kg/m3) x flow rate (m3/s) x force of gravity (m/s2) x height (m)

Horsetooth Reservoir

Horsetooth Reservoir near Fort Collins, Colorado (Photo from the US Department of Interior Bureau of Reclamation)

Efficiency is the efficiency of conversion of hydropower to electrical power. We’ll assume 80%. The density of water is 1000 kg/m3. The force of gravity is 9.81 m/s2; we’ll call it 10 m/s2. The height will depend on our exact system. We’ll explore a couple of options.

Option 1: Horsetooth Reservoir

Horsetooh Reservoir is less than a mile away from the western edge of Fort Collins. There are four earthen dams that make up the reservoir. The reservoir holds 0.2 km3 (200 million m3, 157,000 acre-ft) of water. At the north end is a dam that is 155 feet high. How much electricity could we generate if we let the water out? In order to pump it back we have to store the water downstream somewhere. We’ll talk about that later. Let’s estimate the water level behind the dam to be 50 meters higher than in front of the dam. However, as we’ll see we will be changing that height significantly as the water is released even in a large reservoir like Horsetooth. (Technically, we should integrate as the water is released, but as a first approximation we’ll do the calculation using a static height of 1/2 of the initial height.) Let’s say that our actual head height is 25 meters. Now we can plug numbers into our equation. We need 375 MW of power.

375 x 106 W = 0.8 x 1000 kg/m3 x flow rate (m3/s) x 10 m/s2 x 25 m

Solving for flow rate gives us 1875 m3/s. We need to do this for 18 hours. 18 hours is 64,800 seconds.

Total volume needed is 1875 m3/s x 64,800 s = 121 million m3.

This is 60% of Horsetooth Reservoir drained out every night and pumped back in during the day. A flow rate of 1875 m3/s is comparable to the flow rate out of other large scale hydroelectric plants. Three 6-7 m (20 feet) diameter pipes could do the trick. Pumping the released water back during the daytime needs to occur 3x faster. The giant pumps that are being installed in New Orleans since Katrina can pump at near 625 m3/s. We would need nine of these monsters each costing $0.5 billion to pump all the water back each day.

Another problem is where to put the water. Without worrying for now about land use issues, let’s make a shallow lake downstream from the main dam. If it is 6 meters (20 ft) deep, we need a 33 million m2 area (33 km2,  82,000 acres). That’s a shallow lake 6 km or 3-4 miles on a side. Interestingly, that’s the size of the solar farm needed. Perhaps we can float the solar panels on the lake.

Option 2: Storage Tank Farm

Cushing, Oklahoma oil tank

An Enbridge oil tank at Cushing, Oklahoma (Photo by roy.luck CC-BY-SA 2.0)

The previous solution requires a specific geographical setting that may only be appropriate for certain locations, and since Horsetooth Reservoir is also a recreational facility, we may not want to drain it every night. Is there a way to make this work anywhere with artificial storage tanks? The oil storage facility in Cushing, Oklahoma comes to mind. What if we built large water storage tanks, one above ground and one below ground? What would it take to store enough power to get through the night? The largest of these tanks run about 400 feet in diameter and 70 feet tall. Let’s say we can stretch the limits a bit and get to 500 feet in diameter and 100 feet tall. That would be 150 meters in diameter and 30 meters tall. Each tank holds 530,000 m3 of water. The average height between the levels of water is now only 15 meters (rather than the 25 meters we had for Horsetooth Reservoir). Since we have only 60% of the head, we need 1.67x as much water. Using the number from the previous calculation (121 million m3) this gives us 200 million m3 of water.

Cushing, Oklahoma Oil Tank Farms

A satellite image of the Cushing, Oklahoma oil storage tank farms. The image is about 2 miles horizontal and 1.5 miles vertical.

At 530,000 m3 per pair of tanks, that means 377 pairs of tanks. Each tank takes up a 150 m x 150 m square (about 5 acres or 4 football fields or just over 2 city blocks). This ends up being a 10 km x 10 km (6 mi x 6 mi) water storage tank farm. That area is comparable to the area of Horsetooth Reservoir and the downstream lake that was created.

Feasible?

Either project is grandiose. And keep in mind that we have to do this times 1000 for the US alone. However, such projects are not necessarily engineering impossibilities. Geography might help in many instances. Coastal regions or those near the Great Lakes might be able to use the ocean or lake as the lower level storage tank. The bottom line is that this would be a massive enterprise. On the surface it looks doable, but the scale of the project makes it seem like other options might be better. These will be discussed in future BOTE blog posts.

Check out Energy: What the World Needs Now by Terry M. Gray and Anthony K. Rappé.

Back of the Envelope (1) – How Much Solar Do We Need?

Summary: 375 MW of electricity, an amount currently provided by fossil fuel burning power plants for a population of about 320,000, requires a 2 GW solar farm composed of 5 million 200 W/msolar panels taking up 10 km2 (4 mi2) or 2500 acres of land (just under 1/10 the area of a city of 150,000 such as Fort Collins, Colorado). This will cost nearly $2.5 billion to construct and, if amortized over 20 years, will add $0.03 per kWh to the operational cost of electricity. This assumes some storage technology is available and takes into account intermittency and losses from storage.

Back of the Envelope is a blog series exploring issues related to transitioning from fossil fuel based electricity to renewable electricity production. There are two big issues: first, the scale, i.e. how many  renewable energy sources are needed to replace the fossil fuel sources currently in use; second, because of intermittency issues, i.e. that the sun doesn’t shine at night or that the wind doesn’t blow all the time, extra energy needs to be produced during production times and storage needs to be developed.

I am from Fort Collins, Colorado. Fort Collins gets its electricity from the Platte River Power Authority (PRPA), a public power utility that services Loveland, Longmont, and Estes Park in addition to Fort Collins. The total population served is nearly 320,000. This is a nice number because it represents approximately 1/1000 of the US population. Roughly speaking, we need to multiply whatever we find here by 1000 to cover the whole United States.

PRPA’s sources include coal (about 75%), hydropower (about 20%), wind (about 5%), and some other sources including natural gas for summer peak demand. The daily load profile is typical with a peak load around 7pm and a low around 3am. The average daily load for January 2016 is around 400 MW. Let’s call it 500 MW to account for summer load and in the spirit of a back-of-the-envelope calculation.

Some of PRPA’s energy (25%) already comes from renewable sources. Nationwide the number is between 10% and 15%, but is nearly 35% if you include nuclear. For this calculation I will assume that we need 75% of 500 MW, 375 MW, to replace the fossil fuel sources. I will also do the calculation using solar PV only. Obviously, a real solution will be a combination of solar PV, solar thermal (CSP), and wind. But the land use/resource requirements are similar among the three, so we can get our back-of-the-envelope result by just using solar PV.

Here’s where we’re heading. We need to meet the daytime load. We will assume that daytime is 6 hours per day (a 25% capacity factor). (Perhaps with a combination of wind and solar we could get up to 8 hours per day (closer to a 35% capacity factor).) We will need to produce enough energy while the sun is shining brightly to cover the 18 hours when it’s not. This will be produced during the day and stored somehow. Since storage will not be 100% efficient, we will need to produce additional energy to account for a round trip efficiency, which we assume to be 75%.

Daytime Load

Let’s be generous with our solar panel efficiency and say we can have 200 W/m2 solar panels. That would be a 400 W 1 m x 2 m panel (2 m2 panels).

375 MW x 1,000,000 W/MW x 1 solar panel/400 W = 937,500 panels. Let’s just call it 1,000,000. A million solar panels takes up 2 million m2 of space. A km2 is 1,000,000 m2 so we’re talking 2 km2 (0.77 mi2). That’s a square of land 1.4 km (0.9 mi) on a side. If you think in acres, that’s about 500 acres.

Nighttime Load

We have to multiply everything times 3 to cover when the sun is not shining. So that’s 3 million more solar panels taking up 6 km2 (2.3 mi2) or 1500 acres.

Storage Efficiency Issues

Since the nighttime load has to be stored we will have to increase our numbers to accommodate inefficiencies in round trip storage. Since our efficiency is assumed to be 75% we can divide our nighttime load numbers by 0.75 to get the amount that needs to be stored:  4 million solar panels taking up 8 km2 (3 mi2) or 2000 acres.

Totals

Adding in the daytime load now gives a total of 5 million solar panels and 10 km2 (4 mi2) or 2500 acres. That’s a 2 GW solar farm.

The area of the city of Fort Collins is 56 mi2 so we’re talking about covering an area equivalent to 7% of the entire city with solar panels. These solar panels cost about $200 per panel for a home installation. Since we’re buying 5 million of them, let’s say we can get half off for a total cost of $500,000,000. If we estimate $2/W for installation that’s an additional $2 billion for a total of $2.5 billion.

Assuming our 2 GW solar farm produces electricity for 6 hours a day, 365 days a year for 20 years, we will produce 2 GW x 1,000,000 kW/GW x 6 hours/day x 365 days/year x 20 years = 87.6 billion kWh. That would be $0.03/kWh to cover the initial building of the solar farm. While that’s a lot of money up front, over the long run it’s a decent construction cost per kWh of electricity produced.

The largest solar PV plants in the US today are around 500 MW (Solar Star, Topaz, Desert Sunlight, Copper Mountain) each costing in the $2-$3 billion range. Prices of solar installations continue to come down, so it’s conceivable that we could get a 4x larger plant for nearly the same price.

The general result is that if we switch from fossil fuel sources to intermittent sources with storage that we need to a solar or wind facility that produces 5x the amount of electricity that we get from the fossil fuel plant. In order to make this work we need to store that electricity somehow, not a trivial problem today. We’ll discuss that in future Back of the Envelope posts. And, remember, we need 1000 of these nationwide.

Check out Energy: What the World Needs Now by Terry M. Gray and Anthony K. Rappé.

Communicating Climate Change with Mind and Heart

This past Friday (9-5-2014) I attended Katharine Hayhoe’s lecture entitled “Communicating Climate Change with Mind and Heart.” The sponsor of the event was The University Corporation for Atmospheric Research. Here’s the YouTube video of the lecture. Anyone interested in an abbreviated version of Katharine’s talk can find her recent talk from the 2014 meeting of the American Scientific Affiliation (ASA) or her keynote from the 2011 meeting of the ASA or her book A Climate for Change: Global Warming Facts for Faith-Based Decisions. Katharine is an evangelical Christian who is a climate scientist. Many evangelicals are global warming/climate change skeptics and Katharine seeks to communicate to that skeptical audience that global warming/climate change is real and that the evangelical faith of these skeptics ought to motivate them to see the urgency of the problem and to take action to protect God’s second greatest gift, our planet, and to be concerned about the effects of climate change and its impact on our neighbors (especially in the underdeveloped majority world) whom we are commanded to love.

It was a great talk and I would recommend listening to Katharine and paying heed. As the Q&A time winded down a question came to mind. Unfortunately, I was not able to ask it. I will ask here though and doing so will afford me the chance to develop the question more fully–by the time I’m done it probably won’t feel like a question. Perhaps I can get Katharine to respond with a comment.

Hi Katharine. Great talk and thanks for all you do in communicating the message that faith and science are not incompatible. And thanks for all the tips on how to communicate climate change issues to skeptics.  As you anticipated in the press release this was not a hard-sell crowd. It was Boulder, CO after all–one of the more environmentalist-friendly places in the universe and just down the road from NCAR, the mothership of climate research. You might expect some pushback from this crowd on faith issues. I commend you for your unflinching affirmation of your Christian faith (ever so subtly lifting up Jesus Christ as God’s greatest gift) and calling on Christian values as a basis for action on climate change.

But as you have noted in your talks this is a “tribal” issue and almost everyone in the audience was from the same tribe. You’ve noted how most of us can’t be expert on climate change (or any issue for that matter) and that we get our opinions from the people we trust. So that’s one big issue here. The conservative Christian evangelical (most likely on the right end of the political spectrum) doesn’t trust anyone from the other tribe (and they consider left-leaning evangelicals to be in the other tribe). A few years ago I led a discussion among Christian faculty members at Colorado State University on this very question. This was a thoughtful group of academics but not all were scientists and on the whole they were politically conservative. I asked them if they thought their ideas about environmentalism were determined by the Bible or by their politics, i.e. that if Al Gore thought it was true that it must not be. They all immediately confessed that it was the latter.

As you noted, politically right-leaning evangelicals are going to get their opinion on climate change from people they trust–Fox News, Rush Limbaugh, Glenn Beck, Focus on the Family, Cornwall Alliance and not from Al Gore or Barack Obama or Greenpeace. Sadly, those in the politically right-leaning evangelical tribe who become convinced of the reality and perils of climate change are often thought to have abandoned the tribe. Richard Cizik is a case in point.  Often there is a cluster of positions (abortion, environment, homosexuality, public assistance, national security, etc.) that seem to go together. Politically left-leaning evangelicals are perceived to have more in common with political liberals than evangelicals. (The perception runs the other way as well, I’m sure.) I admit to being at the right end of the political spectrum (even though I’m not a global warming skeptic and am an evolutionary creationist).

One of my dreams is that we right-leaning evangelicals who are scientists and who are convinced of climate change can convince some of these opinion makers on the right to see that climate change is not a right/left issue. The reality is that the opinion makers get their opinion from the people they trust. Why can’t they trust you, for example? Why do they have to trust climate scientists who have contrary views on climate change? Wouldn’t it be amazing if Glenn Beck interviewed you and changed his mind on climate change? So, here’s my question. Don’t you think that convincing these opinion-makers that they are wrong could be a fruitful project. What if we could tell Rush Limbaugh or Glenn Beck that we more or less agree with them on everything except their opinions on climate change? Might we get a hearing?

But this raises a challenge. At  your talk you showed the slide about the Founding Fathers and the issues of taxes and big government. This, I think, is the more fundamental issue and the reason that conservatives tend to be climate change skeptics. The answers of the tribe on the left seem to involve expanding government and increasing government regulation.  In the Slate article about you you promote free market solutions to decarbonizing our energy. I didn’t really hear you talk about this. I’d be curious to hear more. This is why I identify as a non-skeptical heretic. I’d be curious to hear if you put yourself in that camp too.

What are some of the market friendly solutions? Is some kind of carbon regulation necessary (whether cap-and-trade or carbon tax or Hanson’s tax and dividend)? Isn’t carbon regulation at its heart a left-leaning solution? Is there market incentive to moving to carbon free energy. Wind and sunshine are free and don’t get used up–it seems that there ought to be a market solution. Consumers pay less for energy. Companies that offer such services ought to be competitive. I’ve done back-of-the-envelop calculations that suggest that reducing captured CO2 to liquid fuels using carbon free energy (solar, wind, or nuclear) might be profitable given today’s oil prices. Why aren’t these solutions being pursued?

Well, you get the point. If CO2 is a pollutant, then cleaning it up becomes part of the price of producing it. But only if the government makes the oil and power companies (oops–more government regulations) clean it up.  Right? That’s how externalities are properly dealt with. Then the price gets passed on to the consumer. Of course, in the process other solutions (e.g. renewables) may gain some ground. Anyway, is there really a right-leaning solution? Should we press for cap-and-trade as a pseudo-market solution (which doesn’t seem to be working so well in the EU after all, but seemed to work for SOx)?

Some might argue that Christians shouldn’t necessarily be wedded to right-wing politics. I’m all for not letting faith get tangled up in politics, although I’m also a firm believer that faith has implications for all of life, including politics. Suffice it now to say that right-leaning evangelicals find support in a Christian worldview for their views of limited government and individual liberty.

Bottom line–I’m convinced that global warming is true and that human produced CO2 is the chief culprit. And I’m doing all the low carbon footprint things I’m supposed to be doing. What conservative solutions am I supposed to advocate to take care of this problem?

Shameless PlugEnergy: What the World Needs Now by Terry M. Gray & Anthony K. Rappé